
 股票
 板块
 用户
 资讯
Investor Presentation
Q3 2026 report
Rainbow all about growing
Rainbow Global
Manufacturing Base
Spain Manufacturing Base
Weifang, Qingdao, Ningxia Manufacturing Bases
U.S. Houston, Champaign Manufacturing Bases
Subsidiary / Office
R&D Centers
Weifang, Jinan R&D Centers
Weifang Process Development Center
Argentina Manufacturing Base
10
Factories
100+
Operational Countries
Independent Patents
380+
5200+
140+
Staffs Globally
Overseas Subsidiaries
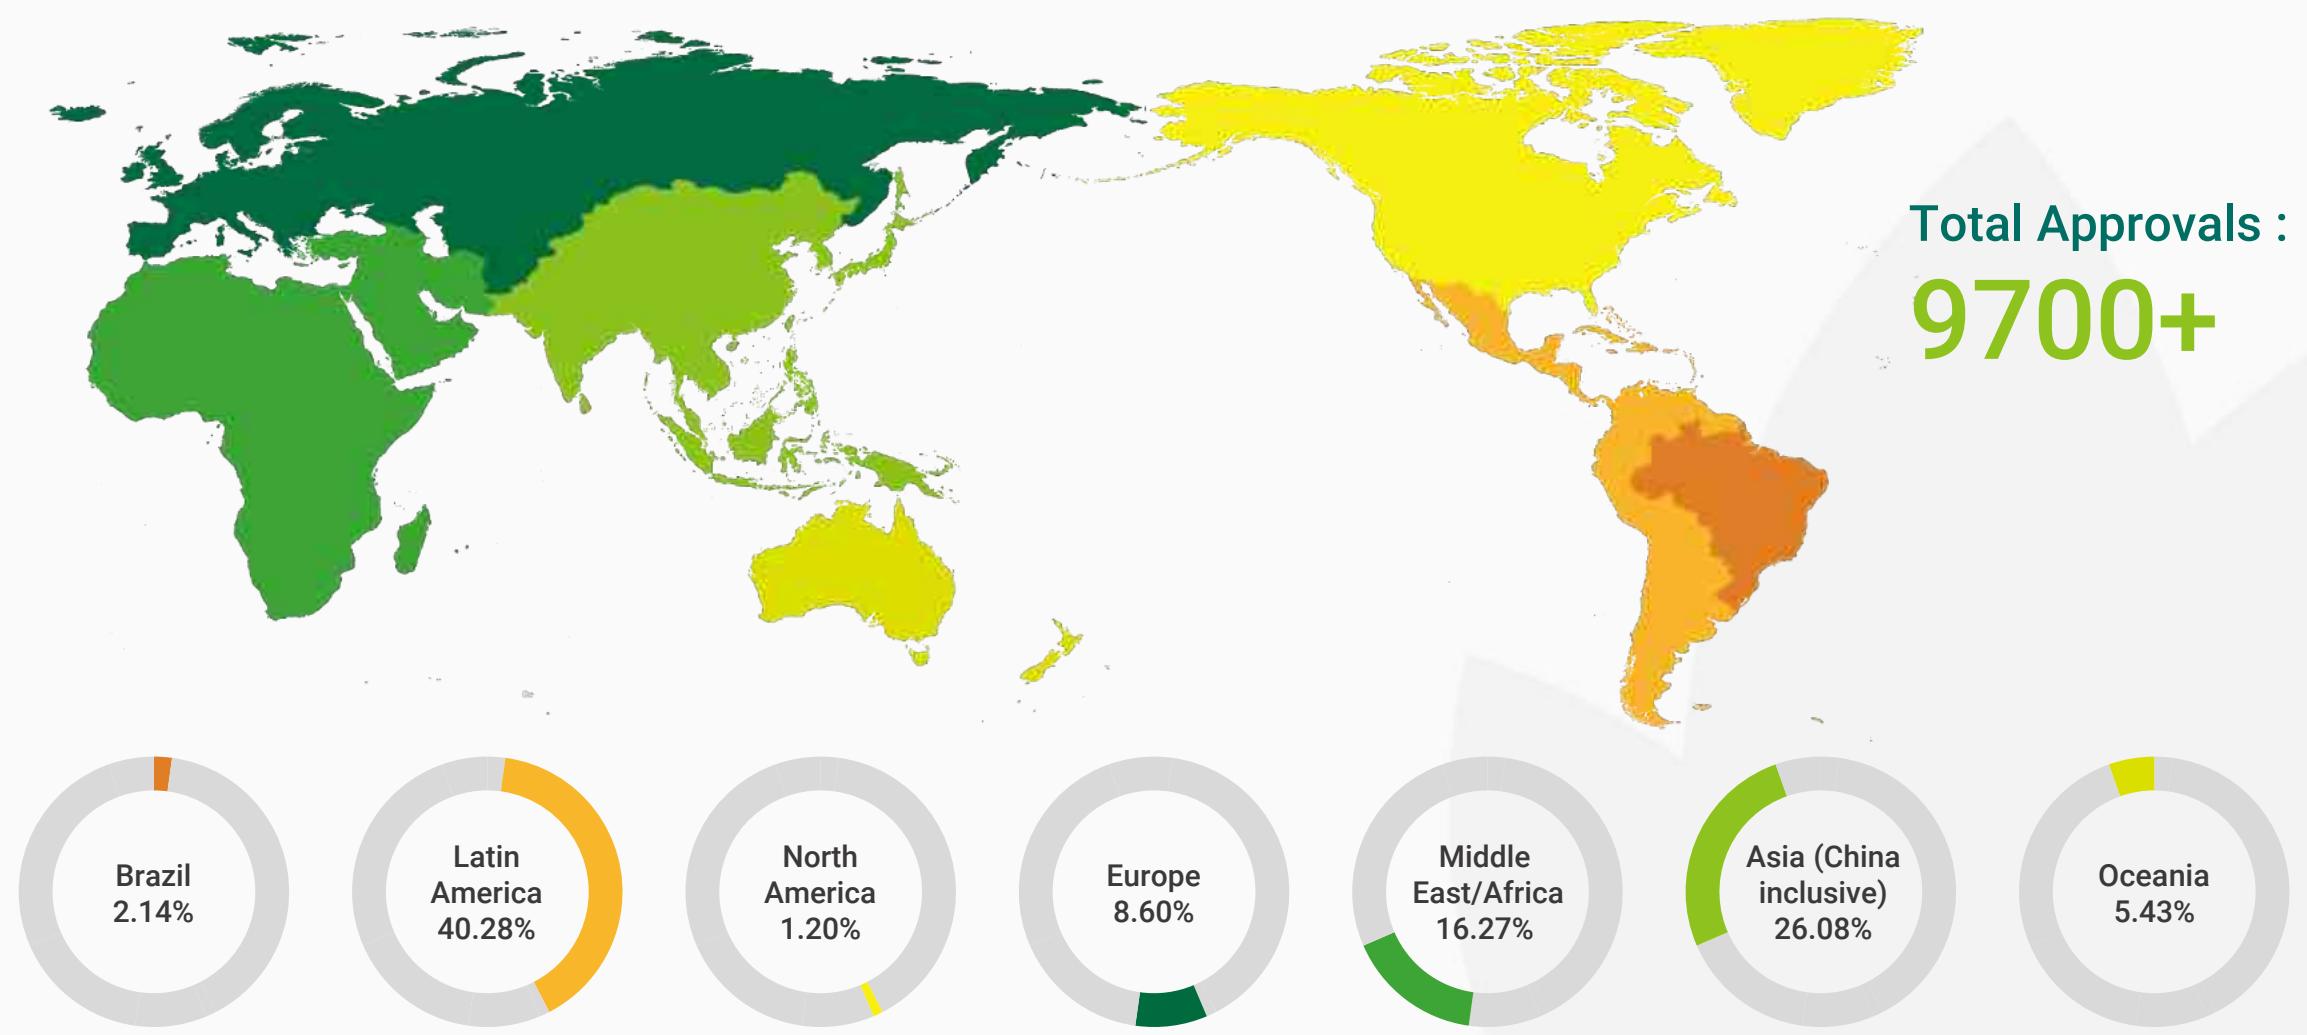
9700+
Registrations Globally
Industry Overview
Export Volume Trends of Products Under China HS Code 3808
Industry Overview
Export Value Trends of Products Under China HS Code 3808
Industry Overview
Export Unit Price Trends of Products Under China HS Code 3808
Performance Overview
Revenue Growing Steadily
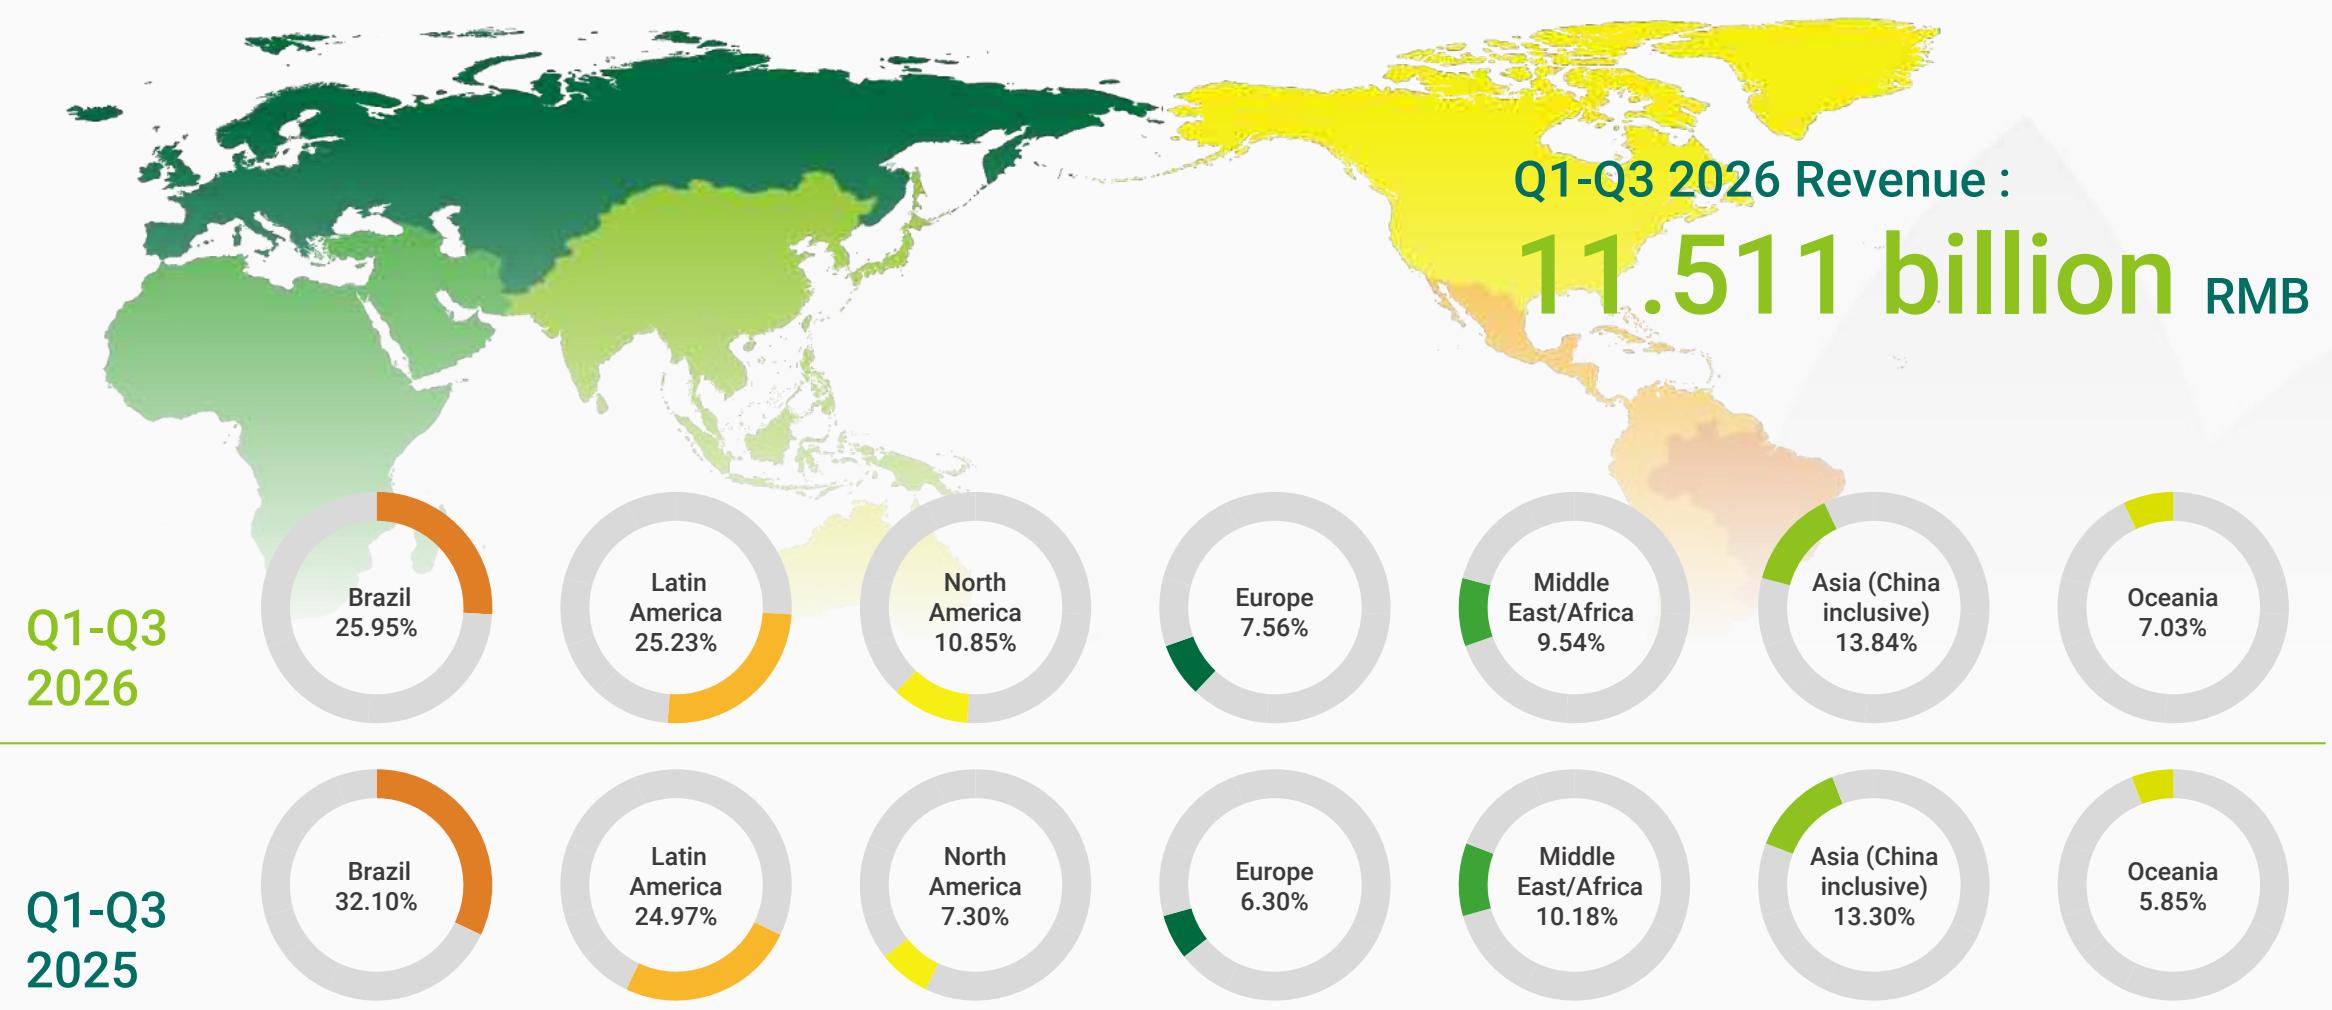
Revenue at RMB 11.511 billion, +5.49% YoY (Jan–Sep 2026)
Deeper global market expansion and rapid growth in North America and the EU further solidified the core business base.

Gross Margin Rate Steadily Improving
Gross margin increased to 24.16% (+2.08pp YoY) for Jan–Sep 2026
Driven by a rising Model C business mix and improved margins across all product lines, reflecting effective profit structure optimization.

EBITDA Increasing Significantly
EBITDA at RMB 1.773 billion for Jan–Sep 2026, +25.79% YoY, growing faster than revenue, confirming the strengthening of high-quality growth drivers.

Core Business Profitability Improving Significantly
Net profit attributable to the parent at RMB 711 million for Jan–Sep 2026, down 20.04% YoY, impacted by RMB exchange rate fluctuations and changes in fair value of FX derivatives. Excluding FX-related impacts, core business profitability improved significantly YoY, reflecting continuously strengthening core competitiveness.

Revenue Up YoY, Reflecting Continued Market Expansion and Deepening Success
Revenue Comparison
Europe & North America
Early-stage expansion with steadily growing revenue
Asia, Oceania and Latin America
Deeper market penetration driving steady growth
Brazil
Revenue slightly down YoY due to delayed procurement season
Performance Overview
Gross Margin Rate Up YoY, Reflecting Improving Earnings Quality
Gross Margin Rate Comparison
1. Model C revenue increased by 6.24pct Rising from 41.39% to 47.63%, with clear contribution from business mix optimization
2. Non-herbicide share at 29.35%, with more balanced growth
3. North America/Europe high-value markets steadily ramping up In early expansion stage, with sustained growth momentum
4. In-House active ingredients projects delivered, smart manufacturing cost reductions evident In-house active ingredients technical upgrades and new project execution, combined with lean smart manufacturing in formulation, serve as a dual-engine driving cost reduction and efficiency gains. Gross margins improved across all business models and product categories
Performance Overview
EBITDA And EBITDA Margin Up YoY, Core Operating Efficiency Strengthening
EBITDA Comparison
Unit: RMB million
EBITDA Margin Comparison
Net Profit Attributable To The Owner Of Parent Under Short-Term Pressure, FX Impacts Main Driver Of YoY Variance
Net Profit Attributable to the owner of Parent Comparison
Unit: RMB million
Parent Net Profit Comparison (Excluding FX)
Financial Highlights
Q1-Q3 2026 Financial Performance Analysis (YoY)
| Currency RMB | Q1-Q3 2026 | Q1-Q3 2025 | % ▲ | Note |
| Sales Revenue | 11,510,518,545.73 | 10,911,452,781.83 | 5.49% | Faster growth in North America, the EU, and Oceania; Brazil's local sales season was delayed |
| Gross Margin (%) | 24.16% | 22.08% | 208bps | Higher Model C Business with improved gross margins across major product lines |
| EBITDA | 1,773,292,503.06 | 1,409,677,857.04 | 25.79% | Revenue and gross margin rate both up |
| EBITDA Margin (%) | 15.41% | 12.92% | 249bps | Gross margin rate improvement and optimized expense control |
| Net Profit Attributable to the Owner of Parent | 711,420,777.82 | 889,733,619.13 | -20.04% | FX losses weighed on parent net profit |
| Net Operating Cash Flow | 769,816,184.91 | 1,740,314,337.78 | -55.77% | Driven by a higher Model C business and increased raw material procurement |
• Q1-Q3 2026: Net Profit Attributable to the Parent at approximately RMB 711 million. Exchange rate-driven forex and hedging losses reduced profit by approximately RMB 402 million. Excluding this, adjusted Net Profit Attributable to the Parent at approximately RMB 1.113 billion.
• Q1-Q3 2025: Net Profit Attributable to the Parent at approximately RMB 890 million. Exchange rate-driven forex and hedging gains increased profit by approximately RMB 140 million. Excluding this, adjusted Net Profit Attributable to the Parent at approximately RMB 750 million.
Financial Highlights
Q1-Q3 2026 Financial Performance Analysis (YoY)
| Currency RMB | Q1-Q3 2026 | Q1-Q3 2025 | % ▲ | Note |
| Selling & Distribution Expenses | 590,693,593.84 | 541,276,149.24 | 9.13% | Mainly due to increased employee compensation, lease expenses, sample expenses, and export credit insurance during the reporting period |
| General & Administrative Expenses | 419,832,673.67 | 401,415,429.92 | 4.59% | Higher administrative expenses mainly due to increased employee compensation, IT costs, and travel costs |
| R&D Expenses | 151,892,506.71 | 133,772,534.32 | 13.55% | Primarily due to increased R&D investment |
Financial Highlights
Q3 2026 Financial Performance Analysis (YoY)
| Currency RMB | Q3 2026 | Q3 2025 | % ▲ | Note |
| Sales Revenue | 4,068,885,589.81 | 4,380,677,448.62 | -7.12% | The delayed local sales season in Brazil, compounded by the company's strengthened gross margin improvement targets and strict credit risk controls |
| Gross Margin (%) | 23.91% | 23.08% | 83bps | Higher Model C shares, with improved gross margins across major product lines |
| EBITDA | 600,599,699.30 | 594,267,382.45 | 1.07% | Higher gross margin rate drives YoY EBITDA growth |
| EBITDA Margin (%) | 14.76% | 13.57% | 119bps | Due to gross margin improvement |
| Net Profit Attributable to the Owner of Parent | 209,563,568.32 | 334,130,258.84 | -37.28% | FX losses and lower revenue drove lower parent net profit |
| Net Operating Cash Flow | 644,730,491.13 | 847,132,095.62 | -23.89% | Driven by a higher Model C business and increased raw material procurement |
• Q3 2026: Net Profit Attributable to the Parent at approximately RMB 210 million. Exchange rate-driven forex and hedging losses reduced profit by approximately RMB 168 million. Excluding this, adjusted Net Profit Attributable to the Parent at approximately RMB 378 million.
• Q3 2025: Net Profit Attributable to the Parent at approximately RMB 334 million. Exchange rate-driven forex and hedging losses reduced profit by approximately RMB 82 million. Excluding this, adjusted Net Profit Attributable to the Parent at approximately RMB 416 million.
Financial Highlights
Q3 2026 Financial Performance Analysis (YoY)
| Currency RMB | Q3 2026 | Q3 2025 | % ▲ | Note |
| Selling & Distribution Expenses | 199,317,275.64 | 200,431,556.18 | -0.56% | |
| General & Administrative Expenses | 143,134,177.32 | 148,272,592.23 | -3.47% | |
| R&D Expenses | 51,739,700.99 | 50,344,221.33 | 2.77% | Primarily due to increased R&D investment |
Financial Highlights
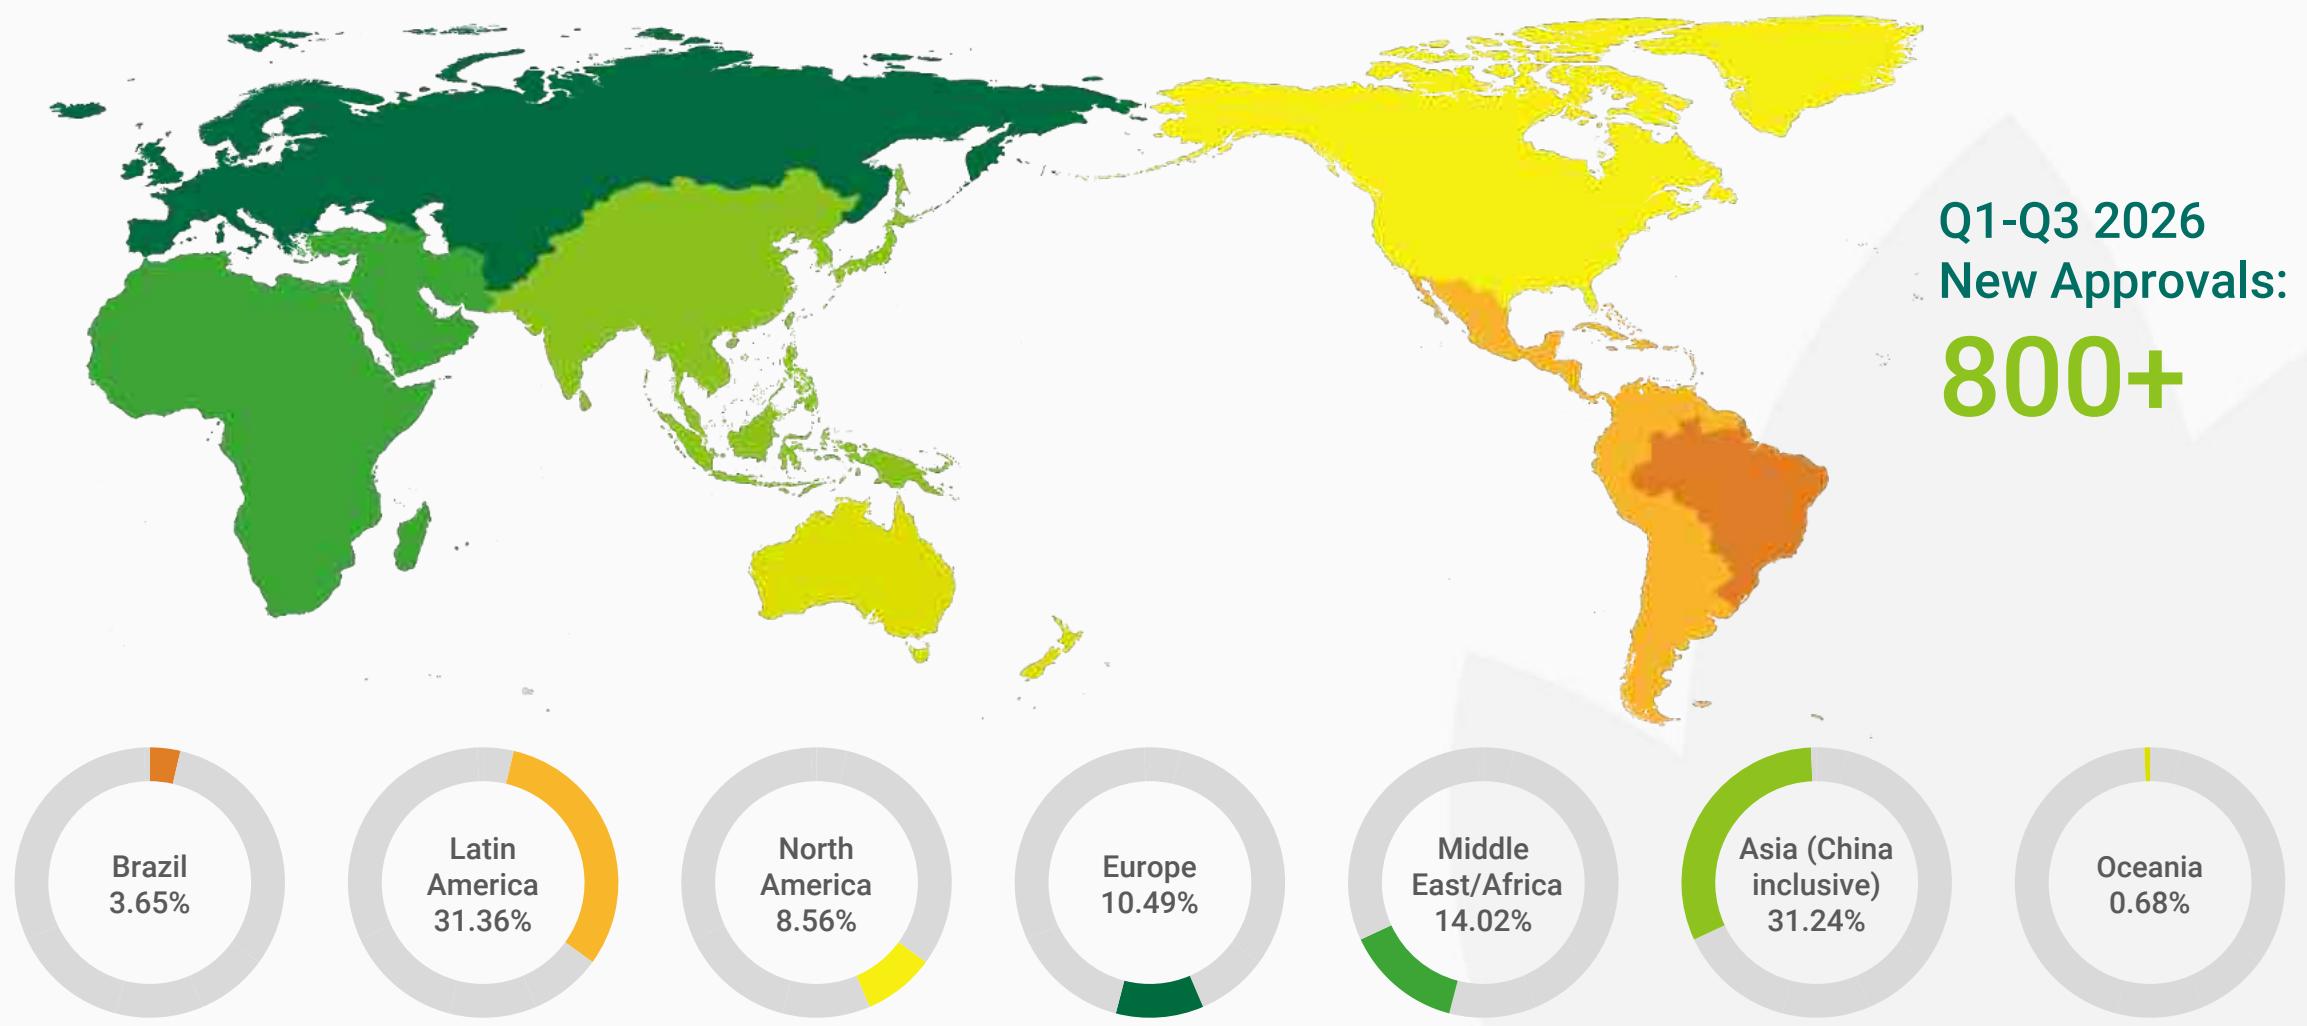
Q1-Q3 2026 New Global Registration Status by Geographic Segment
Financial Highlights
Total Global Registration Status by Geographic Segment as of September 2026
Financial Highlights
Q1-Q3 2026 Revenue Status by Geographic Segment
Financial Highlights
Revenue Share by Segment (YoY)
Financial Highlights
Gross Margin Rate Comparison by Segment
Gross Margin Rate by Segment (Q1-Q3)
Financial Highlights
Revenue by Product Category
Revenue by Product Category (Q1-Q3)
Financial Highlights
Gross Margin Rate Comparison by Product Category
Gross Margin Rate by Product Category (Q1-Q3)



评论 (0)